Search in ideas for "ada cardano"


ADA CardanoHello This Is My Technical Analysis For ADA(Cardano) Crypto Follow & Like And If You Have Question Comment I Answer Good Days And Good Trades.

ADA Cardano Consolidation AreaAfter a perfect play between Support and Resistance:
ADA Cardano is now in a strong support area in which it consolidates before another strong move.
Looking forward to read your opinion about it.

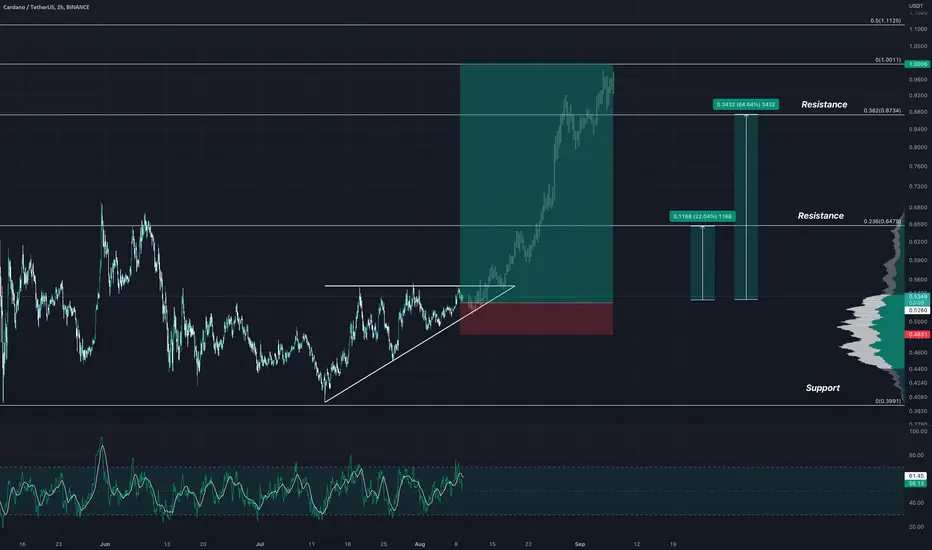
ADA Cardano bullish pattern! Forecast#ADA
▪️Deadline for the deal is 14 days.
▪️Cardano forms a triangle with a flat top - we all already know how this works out
Current price:
0.5317$
Targets:
0.6475$ +22.04%
0.8734$ +64.64%
Subscribe and stay tuned for new ideas. Every day I post 10 profitable ideas a day.
ADA Cardano: 1H Chart UpdateHello friends, today you can review the technical analysis idea on a 1H linear scale chart for Cardano (ADAUSD).
Cardano price looks like it may be headed back down from the current price. Keep an eye on my Support and Resistance Trend Lines. The Fibonacci Retracement shows price has possibility getting back to the 0.382 level. There is also Ichimoku Cloud resistance ahead. On a positive side, the price may be forming a bull flag as well which would bring the price back to $1.00. The RSI was rejected by the resistance trend line so a greater possibility for price to come back down.
If you enjoy my ideas, feel free to like it and drop in a comment. I love reading your comments below.
Disclosure: This is just my opinion and not any type of financial advice. I enjoy charting and discussing technical analysis . Don't trade based on my advice. Do your own research! #cryptopickk

ADA Cardano: 4H Chart ReviewHello friends, today you can review the technical analysis idea on a 4H linear scale chart for Cardano ( ADAUSD ).
Cardano price has been on a downward trend. There are multiple Support and Resistance Lines shown. The price may make an attempt to get to the 0.236 and 0.382 Fibonacci Retracement areas with the Ichimoku Cloud possibly creating resistance. RSI, MACD and MFI look bearish. Price is below the 20, 50 and 200 SMA.
If you enjoy my ideas, feel free to like it and drop in a comment. I love reading your comments below.
Disclosure: This is just my opinion and not any type of financial advice. I enjoy charting and discussing technical analysis. Don't trade based on my advice. Do your own research! #cryptopickk

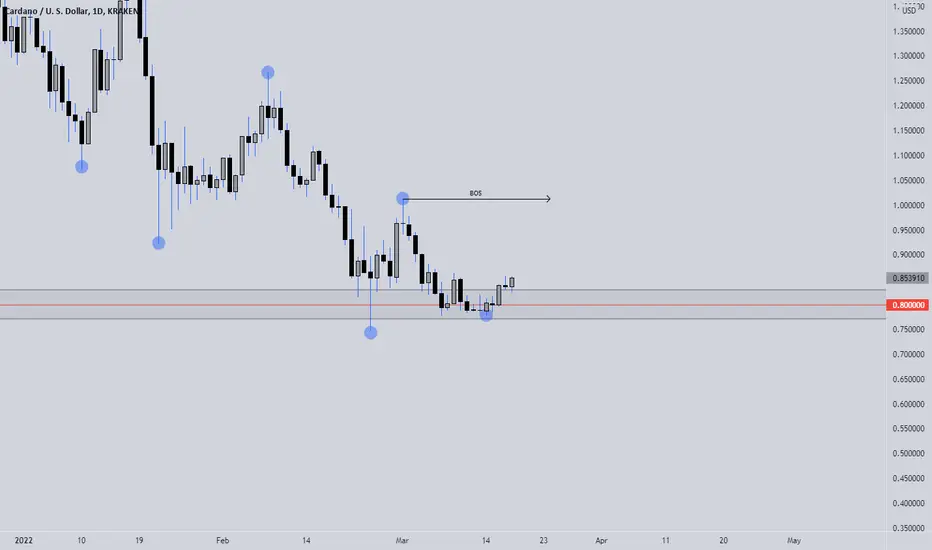
ADA CARDANO LONGS 📉📉📉📉 Expecting bullish price action on ADA CARDANO as price is rejecting an important area of support at 0.80000 psychological barrier, we can see a nice failure swing low or a failure of the bears to push price below the previous lows, for me this means the bears are exhausted and bulls can take control in this area. It is important to understand that this entry is kind of a risky because we are going against the h4 strucutre that is bearish, a more conservative entry would be if price moves above last high (BOS area) retraces back and shoots to the moon 1.5000
BITCOIN is rising we are in a RISK ON MARKET SENTIMENT !! Everything is alligned even fear/greed index that is in extreme fear meaning we should look for buying opportunity.
What do you think ? Comment below..
ADA Cardano: 1M Chart ReviewHello friends, today you can review the technical analysis idea on a 1M linear scale chart for Cardano (ADAUSD).
Cardano price on a monthly chart moved past the recent resistance and looks to head higher. Fibonacci Retracement levels shown along with 200 SMA and RSI.
If you enjoy my ideas, feel free to like it and drop in a comment. I love reading your comments below.
Disclosure: This is just my opinion and not any type of financial advice. I enjoy charting and discussing technical analysis . Don't trade based on my advice. Do your own research! #cryptopickk

Ada cardano update As analysed, after the box breakout and trend line retest,
It brought the price back to decisive levels.
Won't be buying on first pullback, let's wait for further structure formation,
Confluencing it with rsi and price.
Will update soon..
ADA(CARDANO)/USDT #ADA$ADA #ADA 1-3 DAYS AFTER NOW IS SO IMPORTANT.
WE ARE ON THE RSI TREND LINE AND NEAR THE PRICE TREND LINE MAYBE WE HEAR SOME FUNDAMENTAL NEWS. FOLLOW LIKE COMMENT AND RETWEET
#adacoin #CardanoADA #CARDANO #adausdt #BNB #BTC #DogecoinRise #cake #ADABTC #ETH

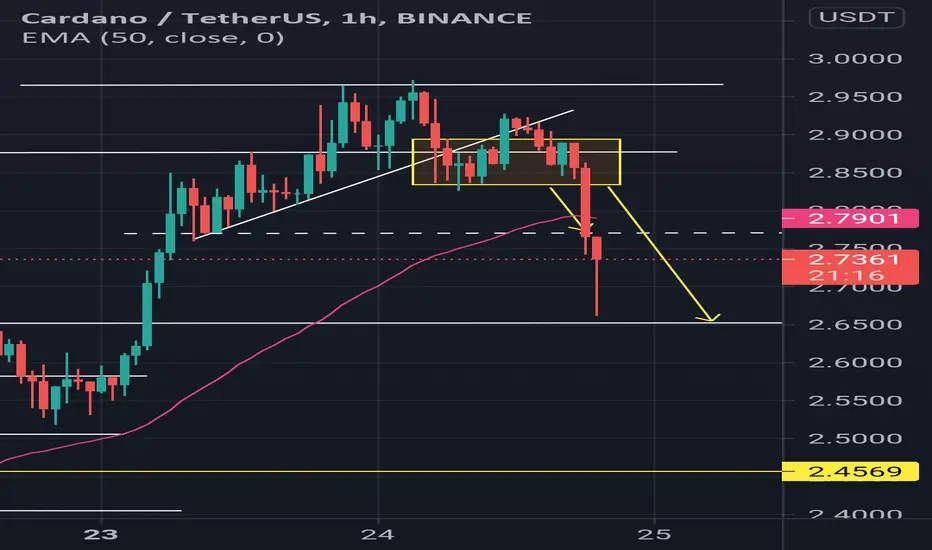
ADA (Cardano) potential drop and entryOn 4H chart, ADA sorting out bearish divergence and we expect this to be Elliott Wave 4 that ends around 2780 - 2800 satoshi levels.
We are not interested in buying Cardano before that level is reached.
We advise everyone to use laddering and start to ladder your orders in from 2900 till 2780 satoshi levels, then sell in wave 5 landing zone between 3705 and 4060.
2780 satoshi levels is previous resistance point that got broken 5 days ago without even testing it once.
Always remember - previous resistance becomes new support and broken support becomes new resistance!
If you find this idea helpful, leave a like, comment and follow us on Tradingview & Telegram!
Any questions? Want to get these ideas first? Feel free to DM.
Have a nice day!

ADA USD ENTRY LEVELS LONGADA - Cardano depreciated a lot to USD. However, there is no turning signal yet. I think we could test eve n $1 support. Market Volume is still low.
The actual price could be interesting for long-term investors. So if you think about the long hold, you can start slowly building your position.

ADA - Cardano - Elliott Wave Cardano looks all set for Big Bull Run.
PS: Check the Bullish parallel zone, upper line is resistance and below line is support.
Enjoy.

ADA, Cardano - did u earn with me? 25%⚡️3 days ago, I wrote about 2 entry points. The first scenario has happened. Congratulations to everyone, 25%!
What's next?
We built a local trend line. I see the entry point only breakout it and retest. Before that, I won't do anything.
Write in the comments all your questions and instruments analysis of which you want to see.
Friends, push the like button, write a comment, and share with your mates - that would be the best THANK YOU.
P.S. I personally will open entry if the price will show it according to my strategy.
Always make your analysis before a trade

ADA → Cardano Heading for $0.65!? In a Key Support Zone.ADA completed its 2-legged pullback per my previous analysis and even overshot the key support zone to Push #1 support at $0.41. Is this an opportune time to long?
Previous Analysis:
How do we trade this? 🤔
Cardano found support at Push #1 support from the previous bull trend around $0.40 and has rebounded to the Daily 200EMA. It's reasonable to expect a pullback from the 200EMA to the $0.45-$0.47 area in the Support Zone. We need a strong bull candle closing on or near its high followed by a confirmation candle to support the idea of longing ADA. Even with such price action, we should be cautious given Bitcoins likely pullback from its recent all-time high and halving period.
That being said, it's reasonable to think Cardano will have more upside before it comes down and with the signal and confirmation bar off of the Support Zone, it's reasonable to enter a long position toward the $0.65 range. Take half profits at 1:1 Risk/Reward at $0.5635, move the stop loss up to the entry price, then swing the latter half of the position to Take Profit #2 target of $0.65. The likelihood of hitting $0.65 is less than ideal, but it's worth holding that second take profit target until the price action gives us a reason to exit the trade.
This analysis is in alignment with my recent ADA Lifetime Analysis as seen here:
💡 Trade Idea 💡
Long Entry: $0.4767
🟥 Stop Loss: $0.3900
✅ Take Profit #1: $0.5635
✅ Take Profit #2: $0.6500
⚖️ Risk/Reward Ratio: 1:2
🔑 Key Takeaways 🔑
1. 2-Legged pullback completed at Support Zone.
2. Double Bottom pattern at Support Zone
3. Strong bull candle to Daily 200EMA, expect a pullback to the Support Zone.
4. Look for a strong signal candle closing on or near its high with a confirmation candle following.
5. RSI is at 41.00 and above the Moving Average, supporting the idea of a long position.
💰 Trading Tip 💰
It's reasonable to take half profits at the first resistance target in a long trade or the first support target in a short trade. Using a 1:1 Risk/Reward Ratio for your first target, you can move your stop loss up to your entry price, locking in profits. This allows you to watch the rest of the trade execute without worrying about losing money, which helps improve trading psychology and the equity in your account.
⚠️ Risk Warning! ⚠️
Past performance is not necessarily indicative of future results. You are solely responsible for your trades. Trade at your own risk!
Like 👍 and Follow to learn more about:
1. Reading Price Action
2. Chart Analysis
3. Trade Management
4. Trading Psychology

ADA → Cardano to $0.40? or $1.40? Get your Longs Ready!ADA completed its 230% price increase since October 2023 and now appears to be finding some resistance. Should we short here?
How do we trade this? 🤔
Shorting is not ideal on the Daily timeframe. Since October 2023, ADA has put in three legs in a bull trend, a double-top reversal pattern that has come off of an ascending wedge (bearish pattern). We're now finding resistance below the Daily 30EMA with a gap down to the Daily 200EMA. This analysis screams a two-legged pullback to the 200EMA, likely in alignment with the Bitcoin halving that's about to happen in April 2024.
Short on the 1HR timeframe, but get your equity ready for a long position when ADA comes into contact with the $0.53-$0.57 price area. Look for a strong bull candle closing on or near its high off of the Daily 200EMA, this is our signal bar and a reasonable one to enter on with a 1:2 Risk/Reward Ratio, aiming for a conservative target of $0.775.
A confirmation bar should take us somewhere in the $0.60-$0.65 range. If we see this, given the crypto market's similar sentiment after the halving, it's reasonable to enter at a 1:2 risk reward aiming for the $1.20 area. It's reasonable to take half profits at 1:1 Risk/Reward and swing the latter half of your position to 1:2, 1:3, or even 1:4 Risk/Reward on this timeframe, depending on how the price action plays out.
This analysis is in alignment with my recent ADA Lifetime Analysis as seen here:
💡 Trade Idea 💡
Long Entry: $0.55
🟥 Stop Loss: $0.4375
✅ Take Profit #1: $0.663
✅ Take Profit #2: $0.775
⚖️ Risk/Reward Ratio: 1:2
🔑 Key Takeaways 🔑
1. Three legs in a bull trend
2. Double top reversal pattern which has come off of an ascending wedge (bearish pattern)
3. Finding resistance below the Daily 30EMA with a gap down to the Daily 200EMA.
4. Look for a 2-legged pullback to the 200EMA, likely in alignment with the Bitcoin halving that's about to happen in April 2024.
5. RSI is at 48.00 and Above the Moving Average, supporting the idea of a pullback to the 30.00 area below the Moving Average.
💰 Trading Tip 💰
It's reasonable to take half profits at the first resistance target in a long trade or the first support target in a short trade. Using a 1:1 Risk/Reward Ratio for your first target, you can move your stop loss up to your entry price, locking in profits. This allows you to watch the rest of the trade execute without worrying about losing money, which helps improve trading psychology and the equity in your account.
⚠️ Risk Warning! ⚠️
Past performance is not necessarily indicative of future results. You are solely responsible for your trades. Trade at your own risk!
Like 👍 and Follow to learn more about:
1. Reading Price Action
2. Chart Analysis
3. Trade Management
4. Trading Psychology

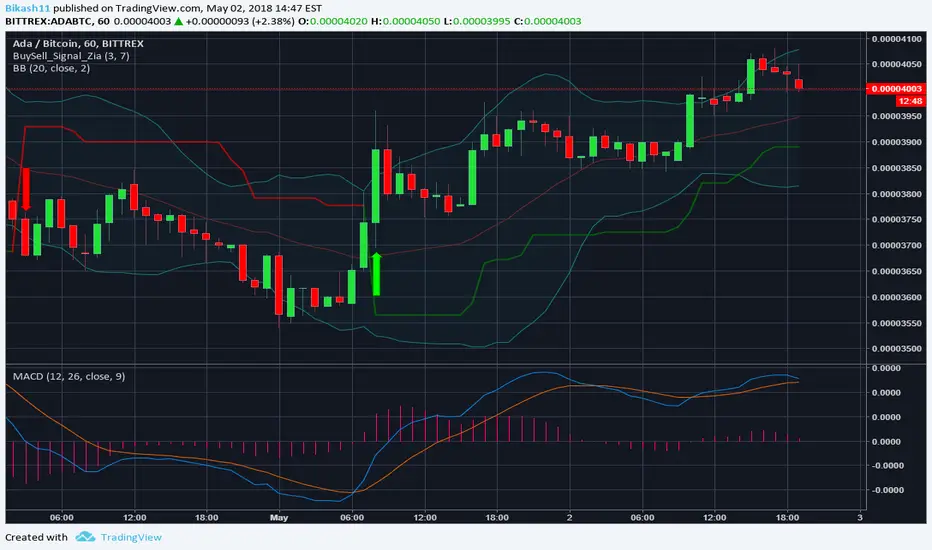
ADA Cardano - My asymmetric 10x investmentHi guys, I'm sharing one of my "wilder" crypto investment - ADA Cardano.
ADA is a new coin. Looking at the chart, there is nothing much to see there. Only a few weeks of trading time.
1 billion USD market cap, 25 billions ADA circulating supply. ADA is already top 15 coin in marketcap.
Cardano is a new blockchain concept, created by an ex Ethereum co-founder, Charles Hoskinson and a professional team from the Cardano Foundation.
You can read all about it and DYOR on their website cardanohub.org.
I'm am convinced that ADA can become a serious player in this market. Especially if they deliver their roadmap on time.
Just one news to show ADA already used in the real world is that a "Barcelona Based Hotel Begins to Accept Cardano As a Method of Payment" (you can find the article on google).
I'm keeping the fundamentals at this level, as said, it's early and you can do your own research on it to be convinced or not.
Looking at the chart, there is nothing much there, only a few weeks of active trading. You can trade this on Bittrex.
I would say that is a starting uptrend, and I see accumulation.
Something is definitely cooking with this coin. There are high chances a big rally can start soon, where the price can be taken 10x or more up.
To note that the current price is below the ICO price.
I do have a small position in ADA and I accumulate myself more. I might be wrong, but if not, I'm looking at an asymmetric risk/reward ratio, which means " very low risk, very high rewards ".
Who invested in NEO when it was 15 cents know exactly what I'm talking about.
I'm stoping here. Thanks and DYOR!

ADA- Cardano Target@$1.40 Hit Case StudiesCardano Token (Chart Analysis Case Study)
ADA- Cardano Target@$0.15 Hit Date Sept 2, 2020
ADA- Cardano Target@$1.40 Hit Date May 1, 2021
Cardano is a decentralized public blockchain and cryptocurrency project and is fully open source. ...
Native tokens to bring new utility to life on Cardano.
Project Website: cardano.org

ADA - Cardano in Rounding Bottom.Hey , I am back with another Trade Idea.
This time looking at Cardano - ADA. ADA was recently added to another big exchange.
ADA is currently in a Clear rounding bottom bullish pattern, even MACD looks like an perfect rouding bottom.
RSI has strong ressistance at 67 level, which was tested bounced back and few days ago was broken.
MACD is giving Strong buy signal with increasing ammount of buyers.
Hope I made your view on whats going on with Cardano somehow clearer.
If you like this TA let me know in the comments, Likes are aprreciated, Thanks !
If this gets a little bit of attention, I will update.

ADA CARDANO/BTC STAIR STEP PATTERN AND ACCUMULATING POWER
So many expectations in this altcoin that could be placed nothing more or nothing less than in the fifth place in the Coinmarketcap ranking.
After having three excellent pumps followed by a period of consolidation when days after having a recession of almost 100% of the last pump remaining flat but consolidating in the shadows, forgotten.
This is the moment when ADA / Caradano needs more than ever back its volume, its people and interest.
Target levels to achieve:
PT1, 2 and 3
And it's just the beginning.
Let's really put Cardano in the 5th place. and let's be clear how many of us who believe in this currency.
How always thanks for the amount of followers that grows every day, likes, thanks for good calls, that fills me with pride to make charts to share with you and with these results.
You can follow me on the steemit channel:
steemit.com
I wait for you and thank you for your time!
More data:
www.cardanohub.org
cardanofoundation.org
coinmarketcap.com
News:
cryptopanic.com

ADA Cardano Equilibrium Pullback and Possible Trade Opportunity🔵 ADA (Cardano) on the weekly timeframe is holding a strong bullish trend 📈. We can see price has retraced into the Fibonacci 50–61.8% zone 🔢, which is typically a pullback into equilibrium ⚖️—an area often considered an ideal continuation entry in line with the trend.
👀 My bias remains long, but let’s break it down further:
📊 On the 4H chart, price action suggests a potential base forming—possibly big money accumulation 💼💰. That said, we don’t yet have a decisive break above to confirm.
🔎 Zooming into the 30M chart, the recent downtrend has been compromised with a shift in structure to the upside 🔄📈. What I’m waiting for now is:
1️⃣ An expansion above the previous high
2️⃣ A retracement and retest
3️⃣ A potential buy opportunity in alignment with trend ✅
This setup also aligns with a possible Wyckoff accumulation 📚—we’ve got relative equal lows, and a liquidity spike below could create a springboard for more bullish activity 🌱🚀.
⚠️ This is purely educational and not financial advice 🔒
